I sometimes wonder why Starbucks doesn't use ceramic coffee cups for in-store purchases. Maybe they read the article by Hocking.
philliptorrone at MAKE: Blog has commented on an article from Institute for Lifecycle Environmental Assessment on the comparison of different materials used in making coffee cups (based on a 1994 article by Martin Hocking in Environmental Management). The key point is that the initial energy cost of creating a ceramic coffee cup is so much larger than that needed to create a foam coffee cup that it takes years of use to break even. 
Figure 1 - The energy per use of each reusable cup (black lines) declines as it is used more times. The energy per use of each disposable cup (green lines) is a constant equal to the manufacturing energy, since it is used only once and is never washed. The numbers in the labels are the manufacturing energies for the different cups.
BillyTheClown had the same reaction I did in the comments section:
The Horrible flaw in this graph is that the energy cost of the reusable cup is not flat as the graph shows.
The graph should be increasing for each use. If you assume the cup is used once as stated in the report then the energy is increases with each use since you need a new cup, were with the reusable cup the energy use decreases with each use.
However, boxcarbill set us straight:
no. the y axis is enegy per use. how you describe it, your second cup would take twice as much energy to make as the first.
energy cost (area under the line) does double with non-reuseable cups.
Ah, it's the area under the curve that we're looking at. But that explanation didn't make me completely comfortable with the graph.
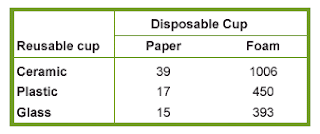
The graph is still misleading for two reasons. First, it highlights the lines, not the area under the lines. That's where my and BillyTheClown's problem comes in. And second, it only shows the energy costs up to 200 uses. The real action in this question occurs between 400 and about 1000 uses, as this chart from the same source shows.

Table 2 - Break-even matrix. Each number shows the uses necessary before the reusable cup listed on the left, becomes equally energy efficient to the disposable cup listed on the top.
Here's a revised chart calculated out to 1500 uses for just ceramic and foam cups.
 (Updated chart to include paper, plastic, and glass.)
The area under the curve for the ceramic cup is 223,351 MJ. For the foam, it's 224,990 MJ. So if you use a ceramic cup twice a day for about 2 years, it will be more energy efficient than using a foam cup twice a day for 2 years. But maybe not by much. The real savings are in the plastic or glass cups.
Source: Hocking, Martin B. "Reusable and Disposable Cups: An Energy-Based Evaluation." Environmental Management 18(6) pp. 889-899.


1 comment:
$tarbuck$ cups and AOL discs are what future archeologists will find for this generation. We stink as a consumer society, or maybe we exceed as a cunsumer society, depends upon your view.
Post a Comment